For part three of my journey in using OpenTelemetry (Otel) with Sinatra I am upgrading to the 0.6.0 release of the OTel gems to get many new features, adding instrumentation to VMPooler, and learning what not to do. Part 3 also includes opening several issues and making my first code contribution to opentelemetry-ruby. Lastly, I will be sharing some more complete code examples showing how all the bits are configured.
Recapping current reality
This recap is so much farther along than the last one. Our current reality at the start of part three is:
- ABS, CITH, and NSPooler have v0.5.x
opentelemetry-*gems generating traces in both test and production - Traces are going from each application to a Jaeger agent
- Each Jaeger agent sends traces to an OTel collector
- Each OTel collector processes data and sends it to both a local Jaeger instance backed by Elasticsearch and to Lightstep.
Chatting in Gitter and the Ruby SIG
The OpenTelemetry projects each have a Gitter channel. I spent a good bit of time chatting in the opentelemetry-ruby one and got some really good tips. I also joined a couple of the weekly OpenTelemetry Ruby Special Interest Groups (SIG) meetings. Those meetings provided a lot of insight into what was going on behind the scenes with the project and also offered a venue to have a real-time chat with the core maintainers about what things on the todo list were most important to me and the goals I’ve been working towards.
The combination of Gitter and the SIG meetings on Zoom have been incredibly helpful.
Tickets pre v0.6.0
Before v0.6.0 came out I opened Unable to add tags to spans #312. The discussion on that ticket was very educational. It also lead to Export resources from Jaeger #348 being done and included in the 0.6.0 release. One of the key reasons this is important is that it allows for setting both basic and custom attributes (tags) that prior to 0.6.0 had to be tacked on by the external Jaeger agent.
One of the key tickets I was watching was OTLP exporter #277 but protocolbuffers/protobuf#1594 threw a big wrench into it being a path forward for me: the problem is that right now the gRPC used by OTLP doesn’t support JRuby… most of the apps I am working on run on JRuby. Fortunately, #231 was already scheduled to be in the 0.6.0 release. That issues called for implementing Binary Thrift over HTTP as a transport for the Jaeger exporter.
The reason that, initially, I was watching #277 and then watched #231 is that either of those being done would mean I no longer had to have a local Jaeger agent; I could, instead, send traces directly from the application via a TCP-based protocol directly to the OpenTelemetry collector.
Upgrading to v0.6.0
Once the new release came out, it was time to start upgrading so that attributes could be set in code and Jaeger agents could be ditched. It also meant that I could start working in earnest on VMPooler since there was no longer a dependency on the agent. Both sets of work started in parallel at this point… which, in hind sight, might not have been my best plan. Read on to see what I mean.
VMPooler part 1: working locally
Things started out pretty simple When I started working on adding the OTel instrumentation to VMPooler. That is, until I ran docker-compose up and watched something about the new tracing code cause the app to crash with only this error as a clue:
E, [2020-09-12T00:36:44.445784 #1] ERROR – : unexpected error in Jaeger::CollectorExporter#export - Not enough bytes remain in buffer
I started digging and found some Jaeger docs for how to Increase in-memory queue size. My initial impression after reading those docs was that I needed the Jaeger exporter to either flush faster or have a bigger buffer. I couldn’t find a way to do that but I did remember seeing that there was an alternative to the SimpleSpanProcessor called BatchSpanProcessor. Sadly, there were not any docs saying what span processor I should use or how to use each one. Fortunately I didn’t give up and poked around in the repository on GitHub and discovered enough info to try it out by reading the comments in batch_span_processor.rb. Though I didn’t exactly understand why, I did find that swapping out the span processor fixed my issue.
During all of this, I had been posting in a thread on Gitter. As a result, I was given this piece of advice:
I think batch span is generally the way to go for anything outside of basic tests, we should probably improve the language here a bit
That was pretty enlightening as every single example shows using SimpleSpanProcessor. I opened Span Processors are basically undocumented #397 in hopes that this would get clarified in a formal way and am happy to report that it is currently listed as part of the 0.7.0 milestone.
Span processors
As mentioned earlier, I was working on both VMPooler’s initial setup and the upgrade to 0.6.0 in the other apps at the same time. That work was going smoothly and seemed pretty simple. The problem was that I didn’t make the mental connection that I should also swap out the SimpleSpanProcessor for the BatchSpanProcessor in ABS, CITH, and NSPooler. This turned out to be a grave oversight as we started having real problems with NSPooler - it was periodically crashing and, as a result, causing problems in our CI pipelines.
Tracing data helps solve the quandary
None of us could quite put our finger on what was going on with NSPooler at first. It just didn’t make any sense. Then, one of my team mates noticed in the Lightstep interface that the /status endpoint was taking over 9 seconds to respond. This too was confusing as there was nothing that should have caused it to slow down like that. It was about this time that I remembered what I had learned a couple of days before while working on VMPooler: never use the SimpleSpanProcessor. In hopes of the two being related I quickly put up a pull request with this change:
  if ENV["NSPOOLER_DISABLE_TRACING"] && ENV["NSPOOLER_DISABLE_TRACING"].eql?('true')
    puts "Exporting of traces has been disabled so the span processor has been set to a 'NoopSpanExporter'"
-   span_processor = OpenTelemetry::SDK::Trace::Export::SimpleSpanProcessor.new(
-     OpenTelemetry::SDK::Trace::Export::NoopSpanExporter.new
+   span_processor = OpenTelemetry::SDK::Trace::Export::BatchSpanProcessor.new(
+     exporter: OpenTelemetry::SDK::Trace::Export::NoopSpanExporter.new
    )
  else
    jaeger_host = ENV.fetch('JAEGER_HOST', 'http://localhost:14268/api/traces')
    puts "Exporting of traces will be done over HTTP in binary Thrift format to #{jaeger_host}"
-   span_processor = OpenTelemetry::SDK::Trace::Export::SimpleSpanProcessor.new(
-     OpenTelemetry::Exporter::Jaeger::CollectorExporter.new(endpoint: jaeger_host)
+   span_processor = OpenTelemetry::SDK::Trace::Export::BatchSpanProcessor.new(
+     exporter: OpenTelemetry::Exporter::Jaeger::CollectorExporter.new(endpoint: jaeger_host)
    )
  end
Lo and behold, that fixed it. And by fixed, I mean that not only did NSPooler stop crashing, but also that response times to the /status endpoint changed significantly:
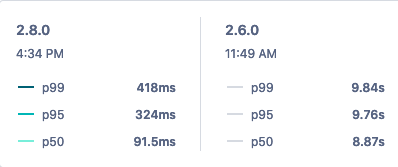
The image above is a screenshot from Lightstep’s interface comparing the latencies on /status between our 2.8.0 release and the 2.6.0 one. As you can clearly see, there is a massive difference.
After seeing how big of an impact this had, I put up PRs for ABS and CITH the following morning to make the same change.
Tickets and pull requests post v0.6.0
While working on the 0.6.0 upgrades and setting up the new Jaeger::CollectorExporter I came across OpenTelemetry::SDK::Resources::Constants::SERVICE_RESOURCE[:name] in its readme. I have not found any docs on this other than in its source code so I opened OpenTelemetry::SDK::Resources::Constants appears to be undocumented #379. That ticket is also slated for the 0.7.0 milestone. Besides the requested documentation update, starting a conversation on this topic resulted in a helper method being added to the configurator so that within a configuration block a user can simply call c.service_name = 'my-service' instead of having to do this:
c.resource = OpenTelemetry::SDK::Resources::Resource.create(
  OpenTelemetry::SDK::Resources::Constants::SERVICE_RESOURCE[:name] => service_name,
)
I liked this so much that I duplicated the work in #417 and submitted feat: Add service_version setter to configurator #426 so that the same could be done for setting an application’s version.
#417 and #426 combined will allow me to simplify my configuration block like so:
- c.resource = OpenTelemetry::SDK::Resources::Resource.create(
-   {
-     OpenTelemetry::SDK::Resources::Constants::SERVICE_RESOURCE[:name] => service_name,
-     OpenTelemetry::SDK::Resources::Constants::SERVICE_RESOURCE[:version] => version
-   }
- )
+ c.service_name = service_name
+ c.service_version = version
Resource detectors
Another thing I learned about by way of a chat happening in Gitter was that there is a feature called “resource detectors” that will automatically detect information about where an application is running and add related resources similar to the name and version ones mentioned above. Enabling that was as simple as adding c.resource = OpenTelemetry::Resource::Detectors::AutoDetector.detect to my configuration block. Doing so allows me to automatically learn quite a bit about both the Kubernetes environment an app is running in and the Google nodes and account on which Kubernetes is running.
VMPooler part 2: ship it!
After getting the other applications updated to 0.6.0 and fixing the goof of not replacing the span processors in the other applications I was able to turn my attention back to VMPooler. I got all the initil tracing code into it via Add distributed tracing #399. I also put in a PR to Add OTel resource detectors #401 into VMPooler. All that worked locally but, it turns out, I had some missundstandings about what went where gem-wise and also didn’t know what all the different Dockerfiles were used for. Both of those got fixed via Fix mixup of gem placement. #404 and Adding make to the other two Dockerfiles #405.
After those four PRs we were finally able to release version 0.14.9 to both our Mesos cluster and to our staging instance in Kubernetes. When doing the release to our Mesos cluster we added these two environment variables so that tracing would be enabled:
"VMPOOLER_TRACING_ENABLED": "true",
"VMPOOLER_TRACING_JAEGER_HOST": "https://otel-jthrifthttp-prod.k8s.example.net/api/traces"
The first of these is used is used by the code below to effectively turn tracing on and the second maps to tracing_jaeger_host in it.
if tracing_enabled.eql?('false')
  puts "Exporting of traces has been disabled so the span processor has been se to a 'NoopSpanExporter'"
  span_processor = OpenTelemetry::SDK::Trace::Export::BatchSpanProcessor.new(
    exporter: OpenTelemetry::SDK::Trace::Export::NoopSpanExporter.new
  )
else
  puts "Exporting of traces will be done over HTTP in binary Thrift format to #{tracing_jaeger_host}"
  span_processor = OpenTelemetry::SDK::Trace::Export::BatchSpanProcessor.new(
    exporter: OpenTelemetry::Exporter::Jaeger::CollectorExporter.new(endpoint: tracing_jaeger_host)
  )
end
You may have noticed that while I am talking about our Mesos cluster the Jaeger endpoint is set to a url containing k8s: this is becaues the endpoint is a Kubernetes ingress resource that passes the traffic on to an OTel collector running in the cluster. The instance of VMPooler that we have running in Kubernetes does not need to use the ingress - it, instead, sends traffic directly to the service resource by way of its in-cluster address: http://otel-collector.otel-collector.svc:14268/api/traces.
Rolling up spans by Sinatra route
This is all live now and working well… except for one thing: VMPooler highly utilizes url parameters that are part of the url itself such as get "#{api_prefix}/token/:token/?" do and the 0.6.0 version of the Sinatra integration doesn’t account for that. The result is that instead of seeing tracing data for the endpoint we actually get unique data sets for each user. Aside from this being less than ideal for seeing how a given endpoint is performing, it also means that all user tokens are exposed within our trace data.
Fortunately, there is already a fix for this that will be included in 0.7.0: fix: default to sinatra.route for span name #415. This PR is incredibly simple on the surface - here’s its entire diff:
  def call(env)
+   span_name = env['sinatra.route'] || env['PATH_INFO']
+
    tracer.in_span(
-     env['PATH_INFO'],
+     span_name,
      attributes: { 'http.method' => env['REQUEST_METHOD'],
                    'http.url' => env['PATH_INFO'] },
      kind: :server,
The result is pretty significant though as it will roll up all calls to /api/v1/token/:token/? into a single data set. Furthermore, I can easily add filters on the OTel collector to redact the actual value of the token before the trace data is stored anywhere. The end result being more useful data that no longer exposes sensitive information.
Bring on the code samples
At the beginning of this post I promised some real code examples that showed how all this was configured so let’s wrap this post up with exactly that.
vmpooler.gemspec
Here are the gems that got added to VMPooler:
s.add_dependency 'opentelemetry-api', '~> 0.6.0'
s.add_dependency 'opentelemetry-exporter-jaeger', '~> 0.6.0'
s.add_dependency 'opentelemetry-instrumentation-concurrent_ruby', '~> 0.6.0'
s.add_dependency 'opentelemetry-instrumentation-redis', '~> 0.6.0'
s.add_dependency 'opentelemetry-instrumentation-sinatra', '~> 0.6.0'
s.add_dependency 'opentelemetry-resource_detectors', '~> 0.6.0'
s.add_dependency 'opentelemetry-sdk', '~> 0.6.0'
lib/vmpooler
There were multiple additions to lib/vmpooler. The first was to require all the needed gems:
# Dependencies for tracing
require 'opentelemetry-api'
require 'opentelemetry-instrumentation-concurrent_ruby'
require 'opentelemetry-instrumentation-redis'
require 'opentelemetry-instrumentation-sinatra'
require 'opentelemetry-sdk'
require 'opentelemetry/exporter/jaeger'
require 'opentelemetry/resource/detectors'
Next was to add in some new configuration settings so that the needed parameters could be passed in through VMPooler’s standard methods:
parsed_config[:tracing]                = parsed_config[:tracing] || {}
parsed_config[:tracing]['enabled']     = ENV['VMPOOLER_TRACING_ENABLED'] || parsed_config[:tracing]['enabled'] || 'false'
parsed_config[:tracing]['jaeger_host'] = ENV['VMPOOLER_TRACING_JAEGER_HOST'] || parsed_config[:tracing]['jaeger_host'] || 'http://localhost:14268/api/traces'
The last addition here is a helper method that can be used to configure all the tracing bits:
def self.configure_tracing(startup_args, prefix, tracing_enabled, tracing_jaeger_host, version)
  if startup_args.length == 1 && startup_args.include?('api')
    service_name = 'vmpooler-api'
  elsif startup_args.length == 1 && startup_args.include?('manager')
    service_name = 'vmpooler-manager'
  else
    service_name = 'vmpooler'
  end

  service_name += "-#{prefix}" unless prefix.empty?

  if tracing_enabled.eql?('false')
    puts "Exporting of traces has been disabled so the span processor has been se to a 'NoopSpanExporter'"
    span_processor = OpenTelemetry::SDK::Trace::Export::BatchSpanProcessor.new(
      exporter: OpenTelemetry::SDK::Trace::Export::NoopSpanExporter.new
    )
  else
    puts "Exporting of traces will be done over HTTP in binary Thrift format to #{tracing_jaeger_host}"
    span_processor = OpenTelemetry::SDK::Trace::Export::BatchSpanProcessor.new(
      exporter: OpenTelemetry::Exporter::Jaeger::CollectorExporter.new(
        endpoint: tracing_jaeger_host
      )
    )
  end

  OpenTelemetry::SDK.configure do |c|
    c.use 'OpenTelemetry::Instrumentation::Sinatra'
    c.use 'OpenTelemetry::Instrumentation::ConcurrentRuby'
    c.use 'OpenTelemetry::Instrumentation::Redis'

    c.add_span_processor(span_processor)

    c.resource = OpenTelemetry::Resource::Detectors::AutoDetector.detect
    c.resource = OpenTelemetry::SDK::Resources::Resource.create(
      {
        OpenTelemetry::SDK::Resources::Constants::SERVICE_RESOURCE[:name] => service_name,
        OpenTelemetry::SDK::Resources::Constants::SERVICE_RESOURCE[:version] => version
      }
    )
  end
end
The self.configure_tracing method isn’t quite as complex as it may look. All that code breaks down to this:
- set a variable for the service name to be used. This is needed because VMPooler can run as two independent services (api and manager) or as an all-in-one.
- update the service name to include the defined prefix which usually maps to a instance’s name such as prod, stage, or test.
- set the span exporter based on if tracing is enabled or not. When it’s disabled the
NoopSpanExporterget’s used so that no trace data is emmitted. When tracing is enabled the endpoint to which to send the data to is also configured. - run OTel’s configurator and tell it to:
- enable automated instrumentation for Sinatra, ConcurrentRuby, and Redis
- use the selected span processor
- enable automatic resource detection
- set
service.nameandservice.version(note that this is using the verbose method - I’ll update it after #426 is merged into the OTel gems)
bin/vmpooler
VMPooler is actually run by calling bin/vmpooler so that is where the final bit go. First, I needed to bring in a few new settings and make a few new local variables. I did that by adding these lines to the file:
require 'vmpooler/version'

prefix = config[:config]['prefix']
tracing_enabled = config[:tracing]['enabled']
tracing_jaeger_host = config[:tracing]['jaeger_host']

version = Vmpooler::VERSION

startup_args = ARGV
With those in place I was able to call the helper method that was added to lib/vmpooler by adding this line:
Vmpooler.configure_tracing(startup_args, prefix, tracing_enabled, tracing_jaeger_host, version)
And that’s all the ruby code that was needed. Beyond that, our Dockerfiles did need the small adjustment of adding the installation of make so that all the gems would properly install.
What’s next?
My Sinatra journey is progressing nicely but there is still more to do. Next up is adding some manual instrumentation to VMPooler and ABS and upgrading to 0.7.0 as soon as it comes out so that I can get the changes talked about above.
With regards to the manual instrumentation part, I have started working on that in Add additional data to spans in api/v1.rb #400 but want to do some manual testing before asking for it to be merged. My learnings there will directly influence how I move forward on a similar PR for ABS.
Bonus: putting the OTel Java agent to use
As a bonus tidbit for anyone who made it through this entire post, I wanted to mention that I have recently started utilizing OTel’s Java agent that provides automated instrumentation of applications running on the JVM. I will be blogging about that work too in the very near future.