I’ve been working on a new logging system based around Elasticsearch, Logstash, and Kibana. One of my biggest challenges was that all the recommended designs I found said that logs should go from a shipper to Redis. The problems with this are twofold:
- Logstash doesn’t seem like a good fit for Windows. The biggest issues are that it relies on Java which isn’t something that is very sellable to any Windows admin that I know. The other is that it simply didn’t work reliably in my testing. The 1.4.x series had performance issues and the copy of 1.5.1 I just tried on Windows 7 is throwing
Windows Event Log error: Invoke of: NextEvent<br></br>
Source: SWbemEventSource<br></br>
Description: Timed out
errors under even the simplest of tests. Unlike other tools it also requires specifying each Event Log that you want to monitor individually as opposed to being able to just grab them all. 2. Not everything can have an agent on it which means that I needed a way to pipe syslog into Redis
The Windows issues were solved by utilizing NXLog as a log shipper but that introduced another problem: NXLog doesn’t have a Redis output. On the plus side though, NXLog seems to be the gold standard when it comes to getting at Event Log data and it can convert the log entries into JSON. This just leaves finding a way to add the Logstash-specific information to the message and then a way to insert that message into Redis. As it turns out, this issue is not that different from the one of piping syslog into Redis. After looking around for several days I found that there weren’t really any good solutions to this other than standing up a separate Logstash server. This seemed like a huge waste of resources and also proved to be problematic when trying to start out with all services on a single node. These needs precipitated me writing Sawyer. Sawyer is a Node.js application that accepts these inputs, massages them accordingly, and then inserts them into Redis for Logstash to pick up.
Infrastructure: Take 1
With Sawyer getting syslog data and JSON from NXLog (or other sources) into Redis I could now focus on really building out my infrastructure. As eluded to earlier, I started out with everything on one box. This included all of the ELK stack, two Redis instances, Sawyer, and Apache. Apache was setup to protect all of this by way of Apache’s mod_authnz_ldap and basic auth. This allowed some rudimentary access control via HTTP Basic Auth backed by Active Directory. Shipping our ISC DHCP logs, firewall logs, all logs from our domain controllers, all logs from our Windows RADIUS servers (NPS Servers), and the Apache logs from the software repository we run quickly caused this setup to fall over.
Infrastructure: Take 2
Since one node wasn’t cutting it I decided it was time to scale the entire system out based on some recommendations from some very helpful people at Elastic. Below is a diagram of the setup I am currently implementing:
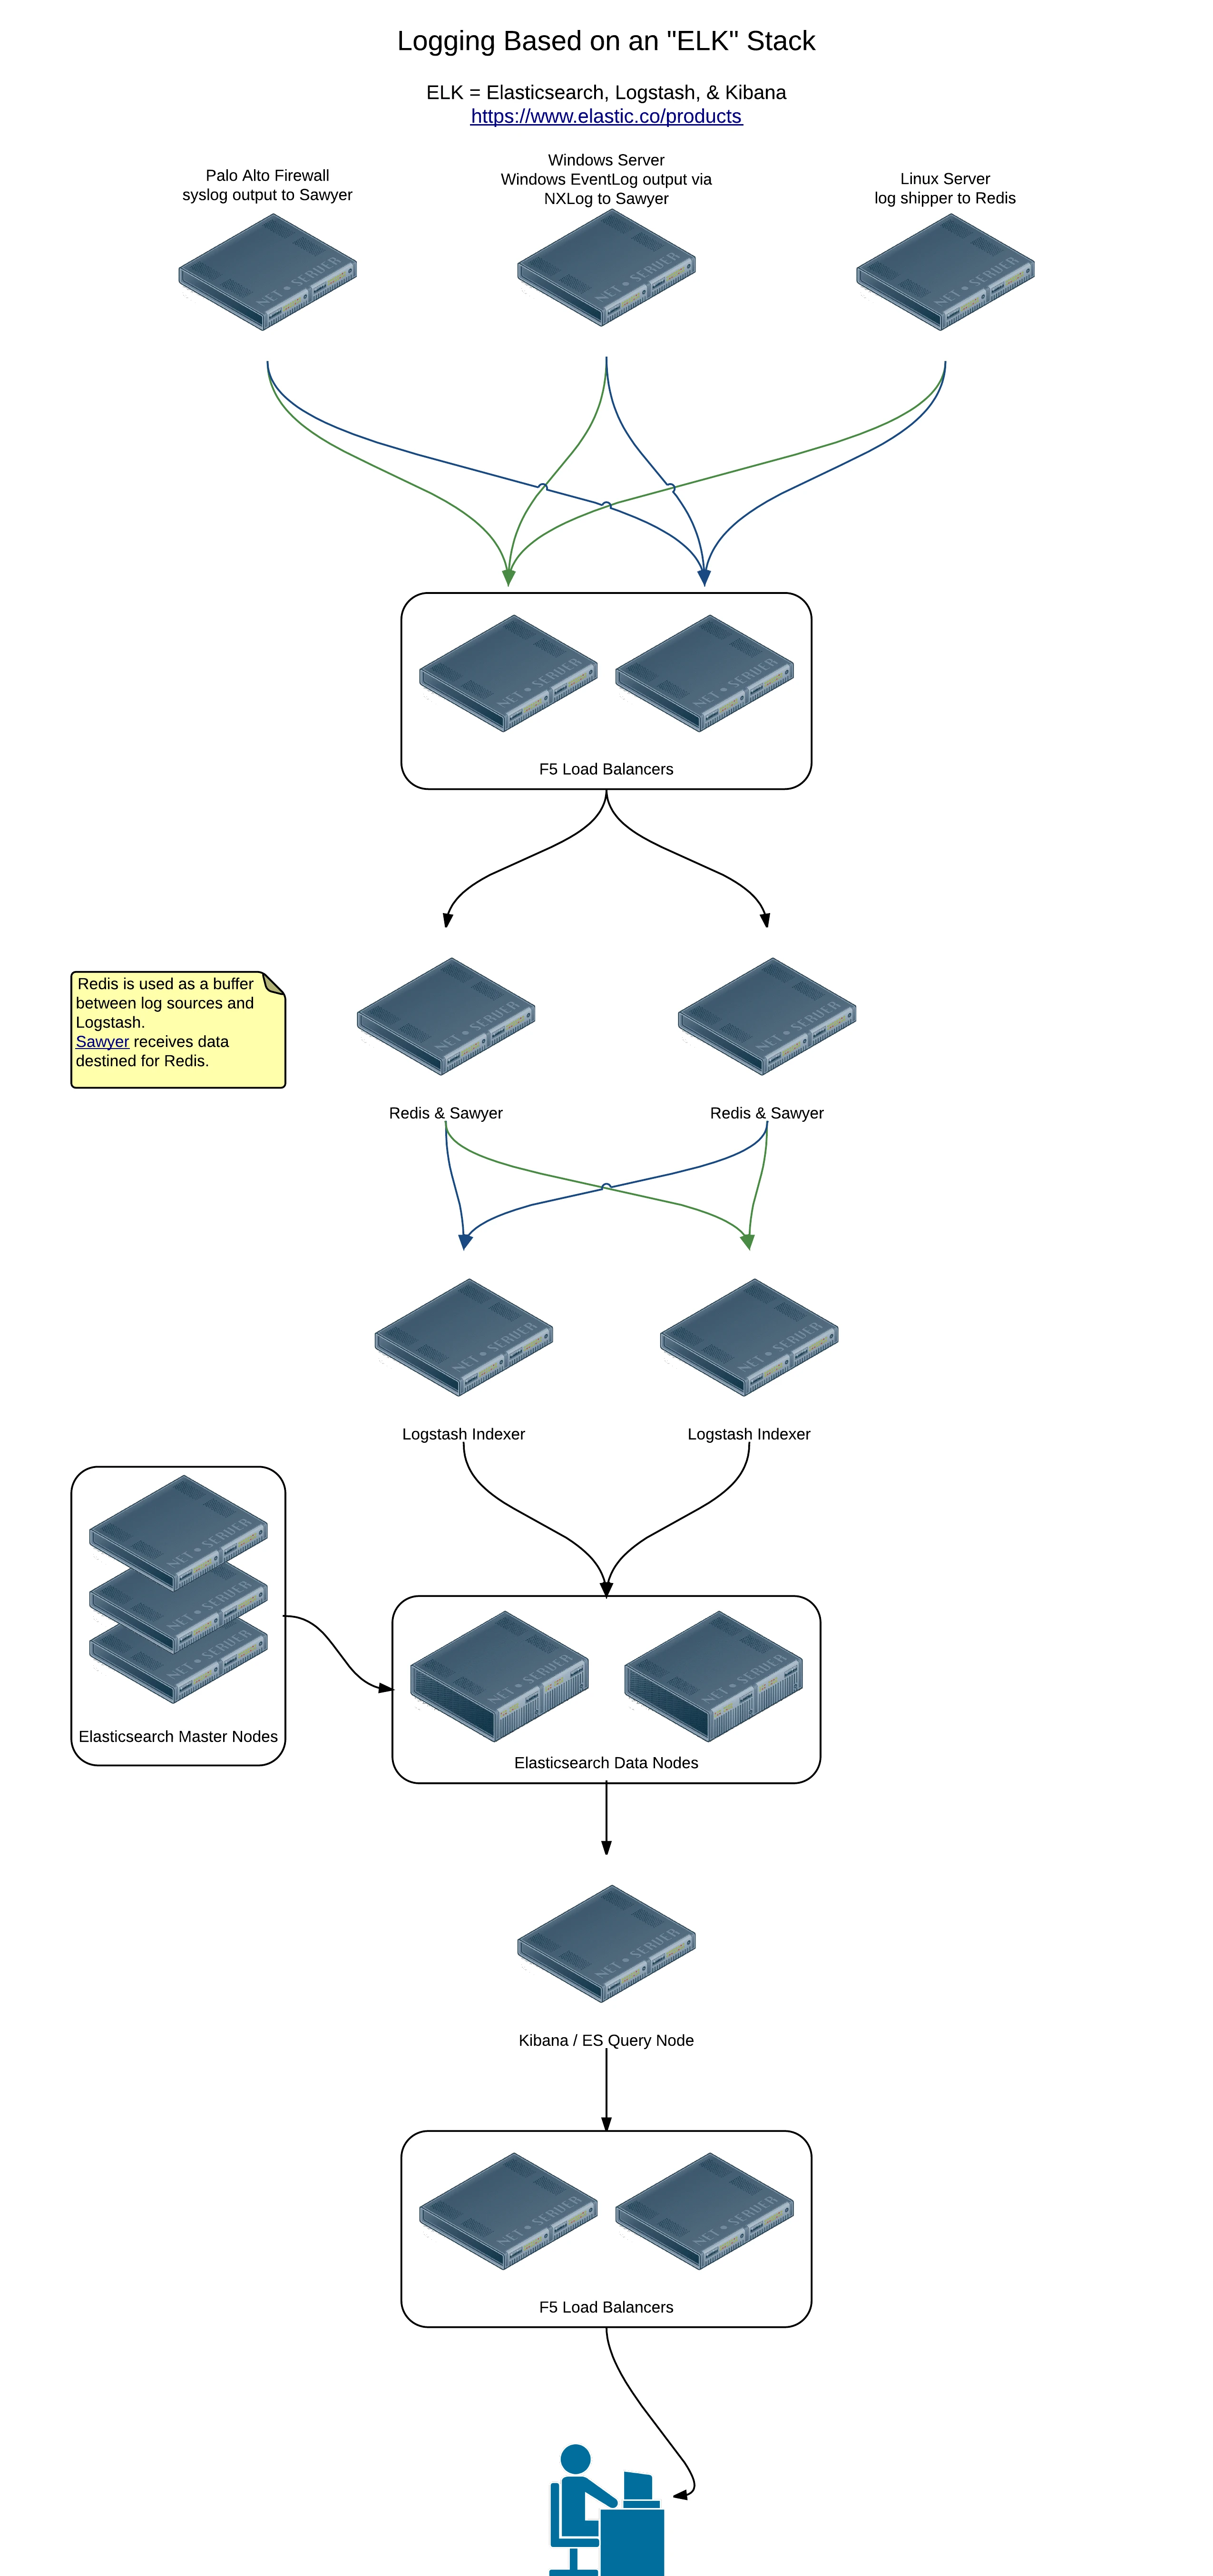
This design accomplishes a few different things:
- more processing capacity for both Logstash and Elasticsearch
- redundancy in data storage
- redundant and load balanced Redis nodes
- dedicated Elasticsearch masters
Each log source in this setup, be it a server with an agent of some kind or a device shipping raw syslog data, is configured to point at a single virtual IP. That VIP resolves to a HA pair of F5 load balancers that route the traffic to a pair of nodes running Redis and Sawyer. A pair of Logstash servers each pull from both Redis nodes, index the data, and output it to an Elasticsearch cluster. Kibana is setup on the same host as an Elasticsearch query node which allows it to pull data from the entire cluster instead of just one of the data nodes.
Licensing and Additional Features
Elastic’s Gold Subscription provides support plus access to some additional products including Shield, Marvel, and Watcher. The subscription is per data node so this setup helps keep the costs down while still providing the recommended resiliency for the masters. Shield gives you the ability to implement full RBAC for you logs, Marvel helps you keep and eye on your cluster, and Watcher allows you to do alerting based on information in your logs. When you combine these features with the comfort of having support it seems like a no-brainer to me.
A note on log shippers
Finding shippers has been the single biggest challenge of this setup. My requirements aren’t that lofty:
- It should be installable via a package manager. On Windows this means it needs to be available via Chocolatey. On Linux I prefer it when the vendor provides repositories for Red Hat and Ubuntu based systems.
- It should be fairly light on resources so that it can be integrated into existing systems without a change in resources (particularly RAM).
- It needs to be able to be managed by Puppet
- It needs to output to Redis or at least output JSON
- It needs to support a variety of inputs including flat files
Here are some of the pros and cons I found while researching the available options:
- Logstash itself is disappointing here… it requires Java which isn’t exactly light on resources. On the receiver-side I do prefer this but may want or need to avoid it on the shipping side.
- Logstash Forwarder is light but only ships via the Lumberjack protocol. To get this into a broker such as Redis I would have to first route it through a Logstash instance. On the up side it does support encryption so it may be of use for certain hosts.
- Beaver, a python application, doesn’t support Windows Event Log and doesn’t really offer anything to tempt me away from other options.
- Woodchuck is written in Ruby which is also a dependency of Puppet so is already installed on all nodes. On the downside, it doesn’t support Windows Event Log nor does it support tagging.
- Fluentd is actually quite nice and looks more and more like what I will end up using as my shipper on non-Windows servers. It can also be used instead of Logstash on the receiving side. I tried an Elasticsearch, Fluentd, and Kibana stack and just didn’t like the format of the data nearly as much. Fluentd also offers integration with programming languages including: - PHP
- Ruby
- Node.js
- Java
This allows for logging directly from applications instead of to a flat file that then must be read and parsed.
Conclusion
All in all I have been absolutely amazed at how easy everything has been to setup. I am quite impressed with everything thus far and am looking forward to finishing my scale out so that I can start shipping logs from many more sources. I plan to start bringing in logs from all servers and their applications, from switches and access points, and everywhere else I can think of.

 Nostr
Nostr